From Filings to Intelligence
Building a Regulatory Analytics Dashboard from MAS Notice 129 Data
If you work in insurance or reinsurance in Singapore, you are probably aware that the Monetary Authority of Singapore publishes detailed annual returns for every licensed insurer. What is less obvious is how much analytical value sits locked inside those filings — and how straightforwardly that value can be unlocked with the right automation approach.
This post documents an end-to-end workflow I built to do exactly that: automatically consolidate MAS annual return data, compute a structured set of KPIs, and surface insights through an interactive dashboard. The result is a market-wide regulatory intelligence tool that reduces the time from “new annual returns published” to “visualised KPIs updated” to a matter of minutes.
Singapore’s insurance market is one of the most transparent in Asia. MAS Notice 129 requires every licensed direct insurer to file detailed annual returns covering balance sheets, revenue accounts, capital adequacy, and line-of-business statistics — all publicly accessible.
Understanding the Data
The returns framework centres on eight principal forms. The key ones for performance analysis are:
- Forms A1 and A2: Fund-level balance sheet and income statement. A2 is the workhorse: it contains gross and net premium written, claims incurred, commissions, and management expenses, all broken down by insurance fund. This is the primary source for profitability KPIs.
- Form A4: Capital adequacy under the Risk-Based Capital 2 (RBC2) framework. Reports Financial Resources (Tier 1 and Tier 2) against the Prescribed Capital Requirement, producing the Fund Solvency Ratio (FSR).
- Form G1: For general insurers and composites: a granular underwriting account split by fourteen lines of business — motor, property, marine hull, work injury compensation, professional indemnity, and others. Essential for line-of-business profitability analysis.
- Forms L1, L3, and L4: For life insurers and composites: premium income by product type and distribution channel, plus individual and group policy movement statistics. L3 provides the closing count of individual policies in force, a useful proxy for market share.
Why Fund-Level Structure Matters
All forms share a common column structure built around insurance funds established under the Insurance Act. For life business there are separate columns for the Participating (PAR), Non-Participating (NPAR), and Investment-Linked (ILP) Singapore Insurance Fund sub-funds. For general business the key fund is the General Singapore Insurance Fund and General Offshore Insurance Fund. A Shareholders’ Fund column captures equity for Singapore-incorporated entities.
This fund-level granularity is what makes the dataset genuinely rich — and what makes analysing it non-trivial.
The Automation Approach: From Raw Files to Consolidated KPIs
Despite the richness of the data, consolidating it manually is prohibitively slow. Returns are published as individual Excel workbooks, one per insurer per year, across dozens of insurer pages on the MAS website. Deriving market-wide KPIs requires stitching these files together, applying consistent definitions, and presenting results in a form that enables comparison across insurers and over time. The automation pipeline I built addresses this in two distinct layers: data acquisition and KPI aggregation.
File Organisation and Automated Consolidation
The raw files, once collected, are organised in a flat-file structure where each workbook is identified by insurer slug and year embedded in the filename. This seemingly minor design choice has a practical payoff: a single regular expression on filenames yields the year without requiring directory traversal, keeping the aggregation layer simple and fast.
The consolidation pipeline using Python opens each workbook, locates the relevant forms by sheet name, and extracts values from specific rows and fund columns. It is intentionally additive-only: files already processed are not reprocessed, so re-running after adding new insurers or filing years completes in seconds. This makes the pipeline practical to run on a recurring basis as MAS publishes new annual returns.
The KPI Framework: What Gets Measured and Why
Raw regulatory data is not insight. The transformation layer computes a structured set of KPIs across three analytical dimensions, grounded directly in the MAS Notice 129 form definitions.
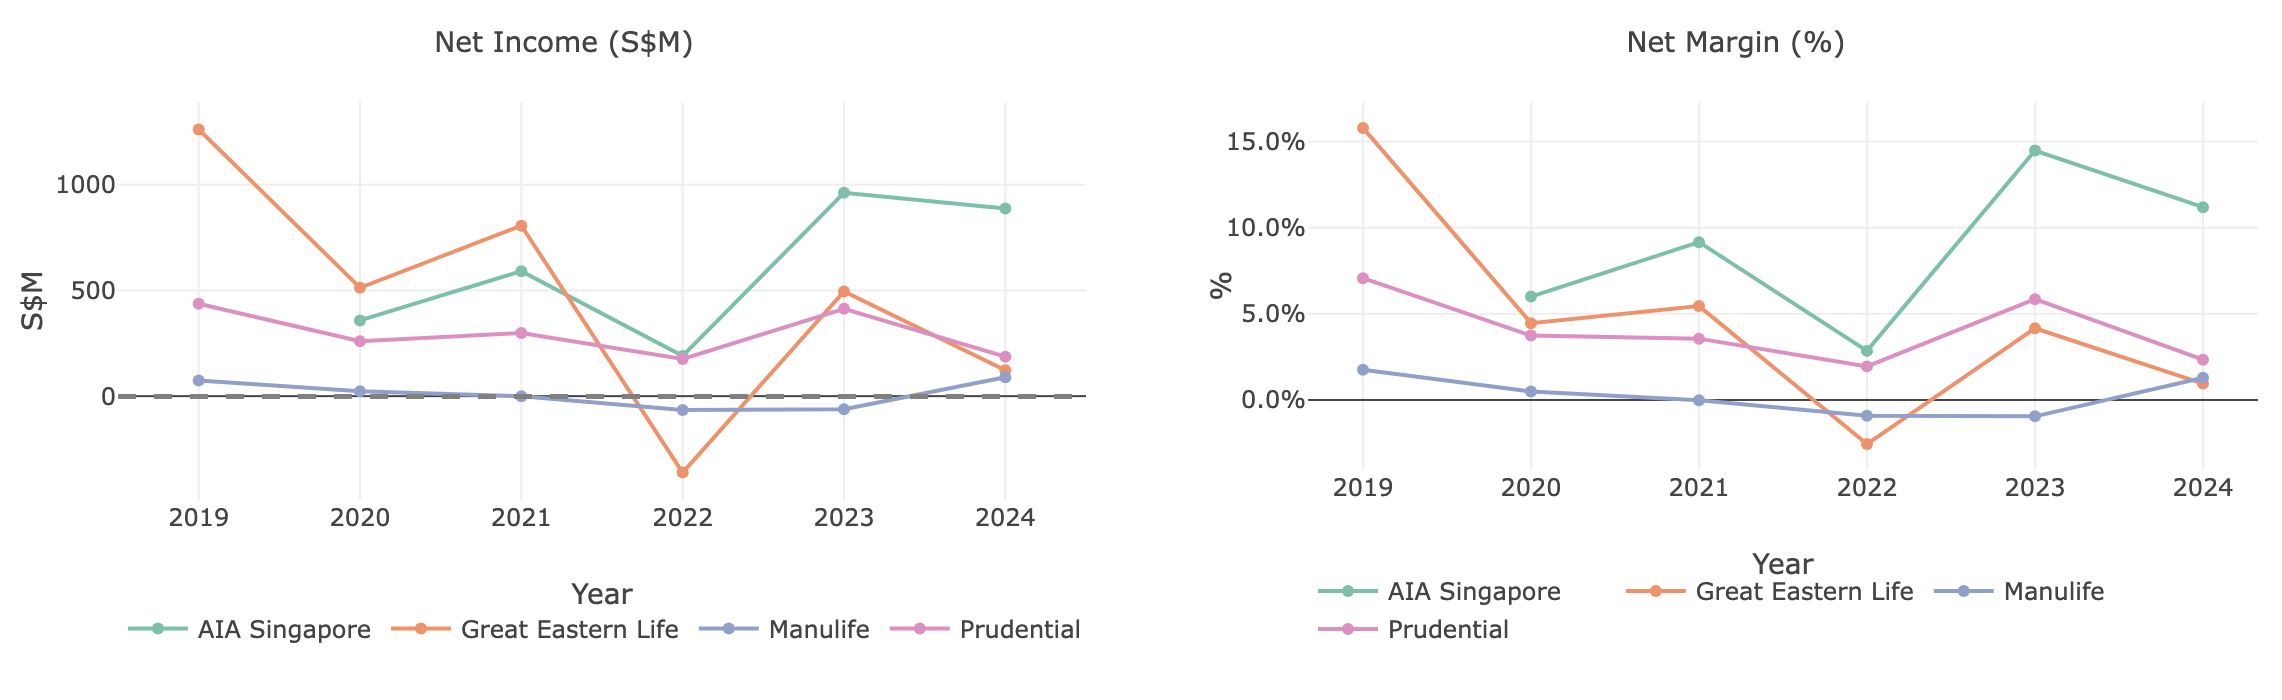
Profitability
The core profitability metrics are computed from Form A2 using the appropriate fund columns. Gross Premium Written measures market size and growth. Net Claims Incurred represents total net claims cost inclusive of reserve movements. The Claims Ratio is Net Claims Incurred divided by Net Premiums Earned; the Expense Ratio is management expenses plus net commissions divided by Net Premiums Written. For general business, the Combined Ratio (Claims + Expense) is the headline underwriting efficiency metric — above 100% indicates an underwriting loss before investment income.
Year-on-year premium growth is tracked separately for the life and general components of composite insurers. Without this separation, YoY growth for year N would incorrectly compare the life component against the prior year’s combined entity total.
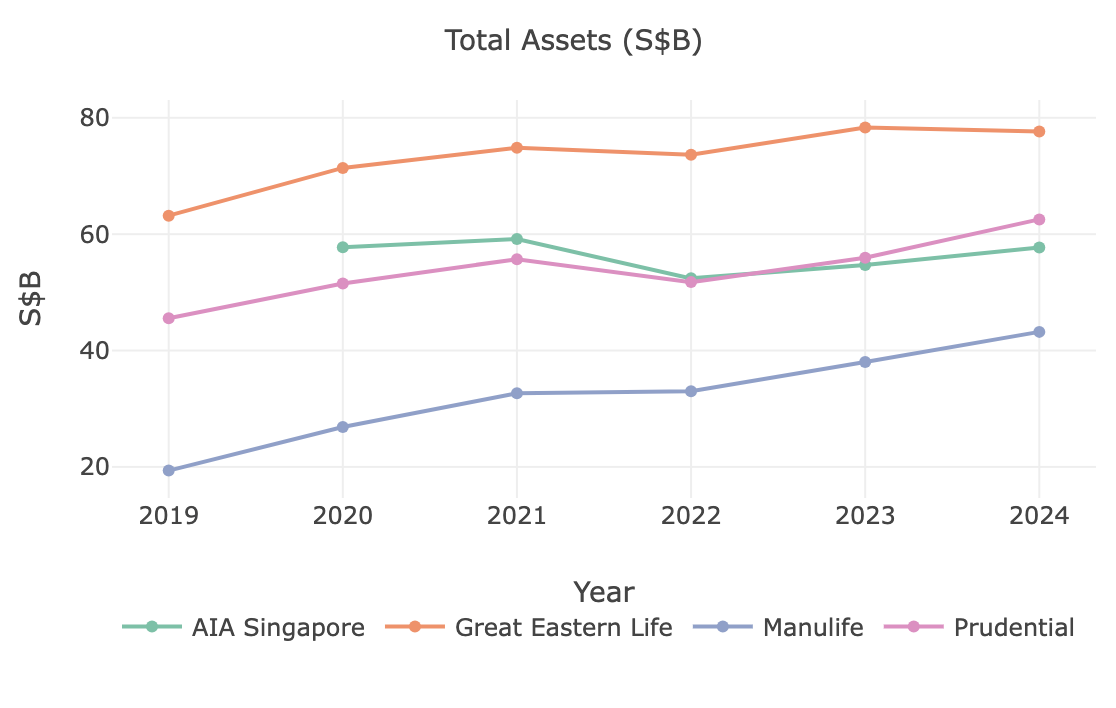
Balance Sheet Strength
Total Assets (A1) provides the fund balance sheet size per component. The Retention Ratio (Net Premiums Written / Gross Premiums Written) measures reinsurance dependency — a lower ratio implies heavier cession to reinsurers. Investment Yield (net investment income divided by average invested assets) captures the return on the investment portfolio attributable to each fund.
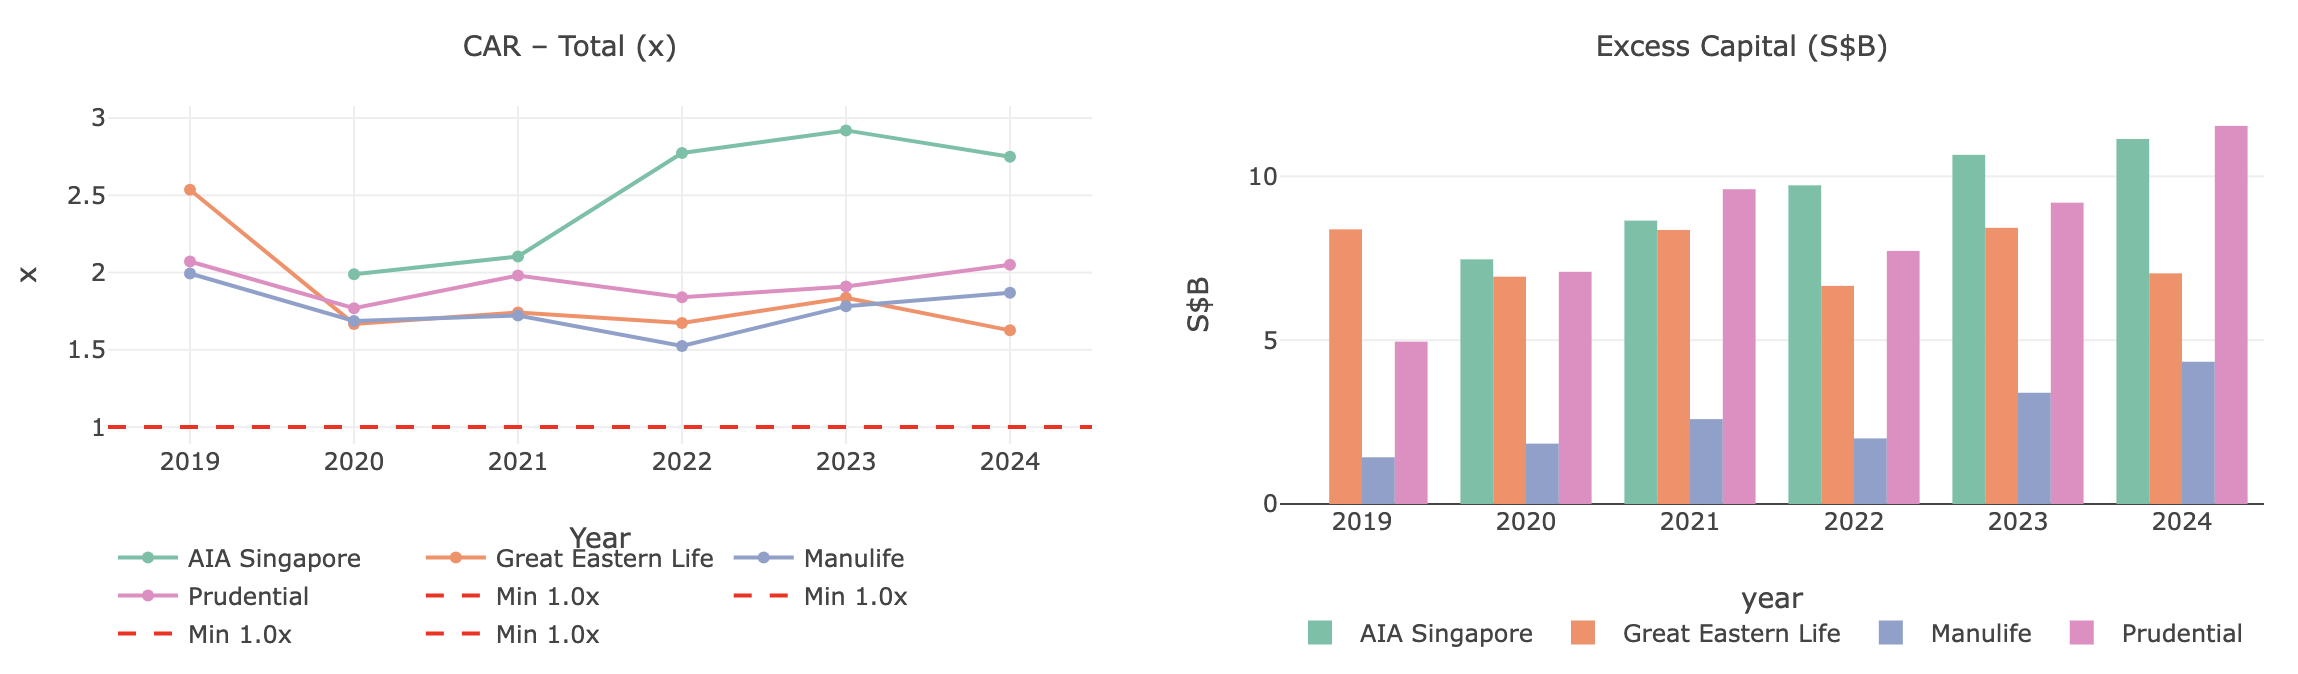
Capital Adequacy
The Fund Solvency Ratio is extracted from Form A4, which reports Financial Resources (Tier 1 and Tier 2) against the Prescribed Capital Requirement under RBC2. A4 is entity-level — it intentionally covers the whole insurer rather than individual lines of business. This is why the FSR is applied uniformly to both the life and general rows of a composite insurer: capital adequacy under RBC2 is an entity-level concept, and an insurer cannot be “solvent for life but not for general” at the regulatory level.
Life Business: Policy Statistics
For life insurers and composites, Policy Count (from Form L3) provides the closing count of individual policies in force per fund. This is derived from a movement table tracking new policies issued, reinstatements, lapses, surrenders, deaths, maturities, and alterations. Lapse and surrender rates are useful proxies for persistency and can surface early signs of competitiveness or mis-selling issues in the portfolio.
From Aggregation to Visualisation
The aggregation script writes a flat CSV file
(all_insurers_kpi.csv) with one row per insurer per year —
two rows for composite insurers. This denormalised structure is deliberate:
it avoids join complexity in the visualisation layer and allows either R or
Python to consume the file directly without transformation.
The Interactive Dashboard
An R Shiny dashboard reads the CSV at startup and renders interactive charts using ggplot2 and plotly. The dashboard covers major life and composite insurers for 2019–2024, with general insurer coverage in progress. Data is sourced from MAS publicly available statutory returns and is updated as new annual filings are published. See the live dashboard at jaren.shinyapps.io/dashboard_insurance.
The dashboard is structured around three analytical views:
- Profitability: Gross and net premium written over time, claims ratio, expense ratio, and combined ratio. Users filter by insurer type (life, general) and select individual insurers for overlay comparison. Composite insurers appear in both filter results. Return on Assets contextualises profitability relative to balance sheet size. Investment Income Yield isolates the investment portfolio contribution — particularly relevant in the post-2022 rate environment, where rising yields improved investment returns for many insurers.
- Balance Sheet: Total assets and Net Assets / Equity track absolute balance sheet size and net worth over time. Policy Liabilities tracks reserve obligations — for life insurers this is typically the dominant balance sheet item.
- Capital Adequacy: CAR trend plots each insurer’s total Financial Resources divided by Risk Requirements over time, with a dashed red 1.0x minimum line. The CAR here is what MAS terms the Fund Solvency Ratio at the entity level — a value below 1.0x would indicate a regulatory breach.
The insurer_type column drives all filtering logic. Composite
insurers are not treated as a separate third category in the UI — they
simply appear in both the life and general filter groups, which is the
correct behaviour for peer benchmarking.
Why Spreadsheets Still Matter
The pipeline also produces structured Excel output. The primary consumers of this analysis are actuarial and risk teams who live in spreadsheets — meeting them where they are matters more than a polished UI. The modular architecture means adding a new insurer or a new filing year is a single configuration change; the KPI computation layer is insurer-agnostic and operates on the normalised schema.
What This Reveals — and What Comes Next
Building this pipeline reinforced several things I suspected but had not systematically confirmed.
Regulatory data is far richer than most people realised — it contains sub-fund level capital breakdowns, detailed reinsurance programme information, line-of-business underwriting statistics, and policy movement data.
KPI design is an analytical choice, not a mechanical one. Deciding which ratios to compute and how to normalise them across insurer structures — participating vs. non-participating funds, ILP vs. traditional, composite vs. pure-line — requires domain knowledge. The framework reflects opinionated choices about what matters for counterparty risk and market analysis in a reinsurance context. Someone building this for a different purpose would make different choices.
The immediate roadmap includes expanding coverage to the full market (the current dataset covers filings from 2019 to 2024 for some major life companies only), integrating with MAS aggregate statistics for macro-level context, and automating the pipeline to process new filings as they become available. The longer-term vision is a reusable regulatory analytics toolkit for APAC insurance markets — MAS Notice 129 is the starting point, but the same architecture extends naturally to APRA in Australia, FSA in Japan, and IRDAI in India.
Insurance regulation generates enormous volumes of structured, publicly available data. The gap between what is filed and what is systematically analysed remains surprisingly wide — and that gap is where the interesting work lives. If you are in actuarial, risk, or reinsurance and want to discuss this further, feel free to reach out.